Excel Blog
Creating Professional Charts in Excel
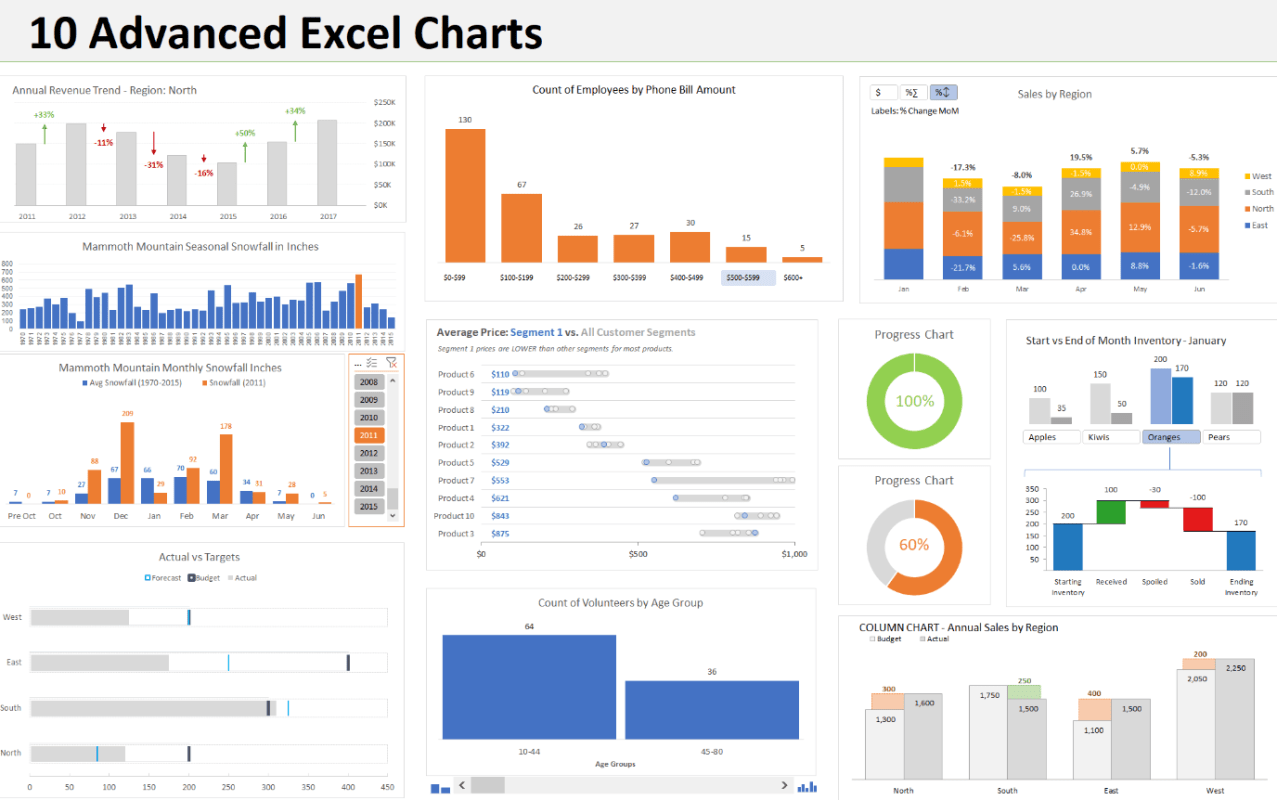
Excel, a crucial component of Microsoft Office, is widely used in various industries for its powerful data analysis and visualization capabilities. Professional charts play a crucial role in presenting data in a clear and visually appealing manner. Whether you are a business professional, analyst, or student, the ability to create professional charts in Excel is a valuable skill.
In this guide, we will walk you through the step-by-step process of creating professional charts in Excel, using specific commands for each step. By following these instructions, you will be able to effectively communicate your data and insights to your audience. Let’s get started!

Step 1: Select your data
- Highlight the data range you want to include in your chart.
Step 2: Insert a chart
- Go to the “Insert” tab in the Excel ribbon.
- Choose the chart type that best suits your data by selecting from the various options available, such as column, bar, line, or pie chart.
Step 3: Customize your chart
- Double-click on the chart title to edit it according to your needs.
- Right-click on axes, labels, or the chart background to access formatting options and make necessary adjustments.
- Explore the “Format” tab in the Excel ribbon for additional customization options.
Step 4: Add data labels and legends
- Click on the chart to select it.
- On the “Chart Design” tab, check the boxes for data labels and legends to enable them.
- Customize the appearance and position of data labels and legends using the formatting options available.
Step 5: Format your chart elements
- Select the specific chart element you want to format, such as gridlines, data points, or the chart area.
- Access the formatting options through right-clicking on the element or using the “Format” tab in the Excel ribbon.
- Experiment with different styles and options to achieve the desired visual effect.
Step 6: Update your chart
- Modify the underlying data by editing the values or adding new data points.
- Right-click on the chart and select “Edit Data” or use the “Design” tab to access the “Edit Data” option.
- Make the necessary changes in the data and click “OK” to update the chart accordingly.
Continue following these steps, making adjustments and updates as needed, to create professional charts in Excel. With practice and exploration of the available features, you can master the art of data visualization and effectively communicate your insights.
Mastering the art of creating professional charts in Excel enables you to present complex data in a clear and concise manner. By following the steps outlined in this guide and using specific commands, you will be equipped with the necessary skills to create visually stunning and impactful charts using Excel. Let’s dive in!
Discover the best solutions for your database management needs on our website, where we offer a wide variety of cheap Microsoft Office licenses. Choose from the cheapest Office 2016 keys, Office 2019 cdkeys, and the cheapest Office 2021 cd keys available.

