
Excel Blog
Creating Interactive Excel Dashboards

Excel dashboards are a powerful and effective way to visualize data, enabling you to gain valuable insights that can inform your decision-making process. With Microsoft Excel’s comprehensive set of tools, creating interactive dashboards has become incredibly accessible and user-friendly.
Here’s a step-by-step guide that will walk you through the process of creating an interactive Excel dashboard, empowering you to effectively track, analyze, and interpret your data for optimal decision-making.
Step 1: Define your key metrics
- Identify the key metrics that you want to track.
- List them in a separate sheet in Excel.
Step 2: Create a data model
- Organize your data into tables or queries.
- Create a data model by going to the Data tab and selecting Get Data.
- Import the data into Excel, and create the necessary relationships.
Step 3: Create a pivot table
- Select any cell within the data set.
- Go to the Insert tab and select PivotTable.
- Choose the range of cells that you want to include.
- Drag and drop the key metrics into the Values area of the pivot table.
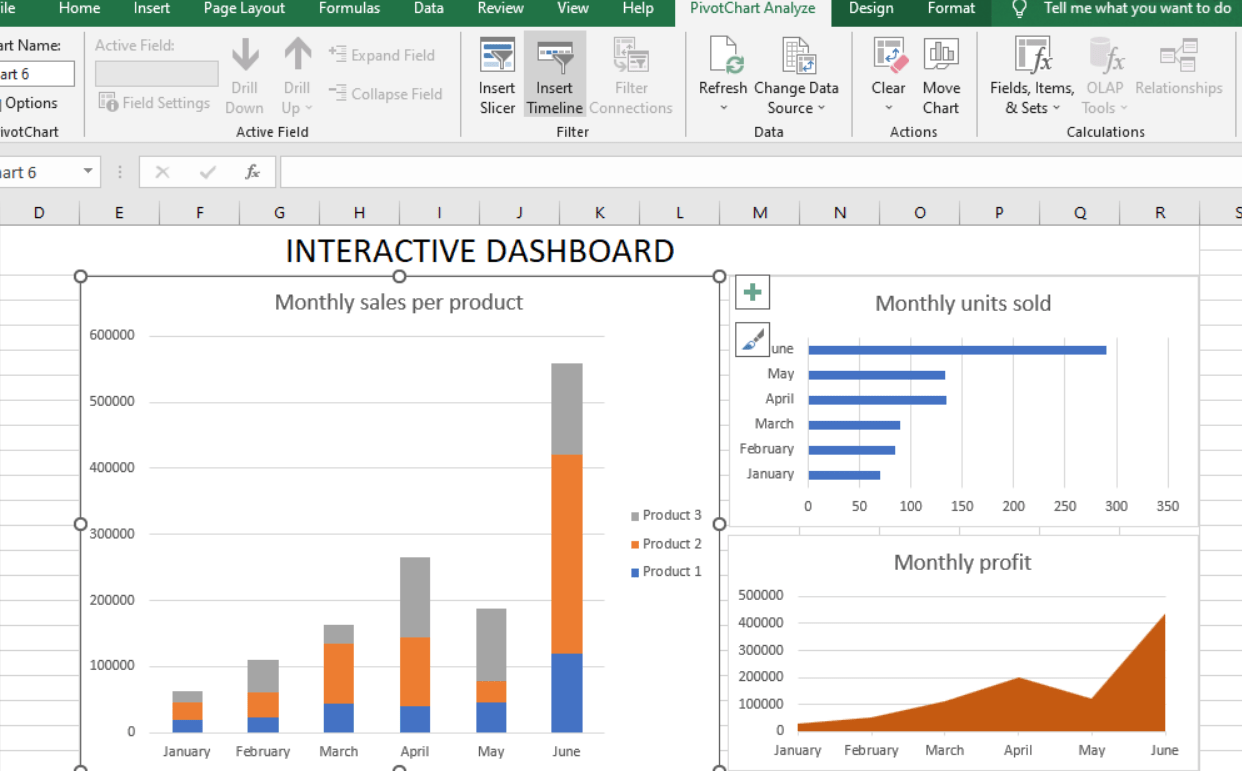
Step 4: Create charts and visuals
- Select the pivot table and go to the Insert tab.
- Choose the type of chart you want to create.
- Select the chart data range.
- Customize the chart as necessary.
Step 5: Add interactivity
- Create interactive features such as dropdown lists or radio buttons.
- Go to the Data tab and select Data Validation.
- Choose the type of input you want to create.
- Customize the input range as necessary.
Step 6: Create a summary sheet
- Create a summary sheet by copying and pasting all the visuals and charts.
- Group them and create hyperlinks to the detailed reports.
Step 7: Publish and share the dashboard
- Save the dashboard in a shared location such as OneDrive, SharePoint, or Teams.
- Share the dashboard link with the relevant stakeholders.
Creating an interactive Excel dashboard is a powerful way to visualize your data and provide insights that help inform decision-making. Follow these steps and make the most of this feature to improve your data visualization and analysis skills.
Maximize your database management capabilities with the right Microsoft Office license from our website. Choose from a range of options including cheap Office 2016 license , Office 2019 cd keys, and the cheapest Office 2021 license, and take your productivity to new heights.