
Office Blog
What is the Function of the Report Design Feature in Access?

The Report Design feature in Microsoft Access is a robust tool that empowers users to generate tailored reports, effectively presenting data extracted from tables and queries in a visually appealing and structured format. This feature is essential for users looking to analyze and communicate their data effectively, whether it’s for business analysis, academic research, or project management purposes. In this detailed guide, we’ll walk you through the step-by-step process of leveraging the Report Design feature to create polished and informative reports.
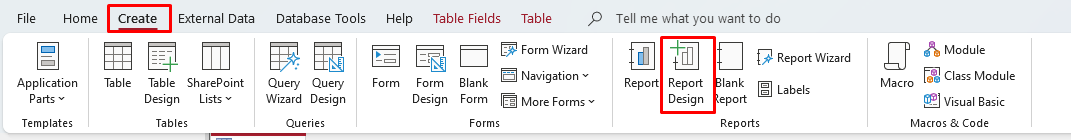
To begin utilizing the Report Design feature, users can access it by navigating to the “Create” tab in Microsoft Access and selecting the “Report Design” option. This opens up a blank canvas where users can design their reports from scratch, incorporating various elements such as tables, charts, text boxes, and images. Alternatively, users can choose from a selection of pre-designed report templates to expedite the design process and customize them according to their specific needs.
Once in the Report Design view, users have the flexibility to customize every aspect of their reports, including layout, formatting, and data presentation. They can add fields from tables and queries, adjust formatting styles, apply conditional formatting, and insert headers, footers, and page numbers to enhance the overall appearance and usability of the report. Additionally, users can incorporate grouping and sorting options to organize data logically and facilitate analysis. With the Report Design feature in Access, users can create professional-grade reports that effectively convey insights and information to their audience.
Step 1: Open Microsoft Access
Launch Microsoft Access and open the database containing the tables or queries you want to use for your report.
Step 2: Create a New Report
Navigate to the “Create” tab in the ribbon at the top of the screen and click on the “Report Design” button. This creates a blank report in design view, ready for customization.
Step 3: Add Data Source
To include data in your report, you’ll need to specify the tables or queries from which you want to gather information. Click on the “Add Existing Fields” button in the “Design” tab of the ribbon. Select the desired table(s) or query(ies) and click “Add“. The fields from the selected data source(s) will now appear in the “Field List” pane.
Step 4: Design the Report Layout
Using the tools in the “Design” tab, you can customize the layout and formatting of your report. Drag and drop the desired fields from the “Field List” pane onto the report’s detail section to display the data. You can also modify the appearance of the report by adjusting font styles, adding headers and footers, or incorporating images and logos.
Step 5: Apply Grouping and Sorting
Organize your report by grouping and sorting data based on specific criteria. In the “Design” tab, click on the “Group & Sort” button. Specify the field(s) by which you want to group or sort the data and set the desired sort order. This helps to present the information in a logical and meaningful way.
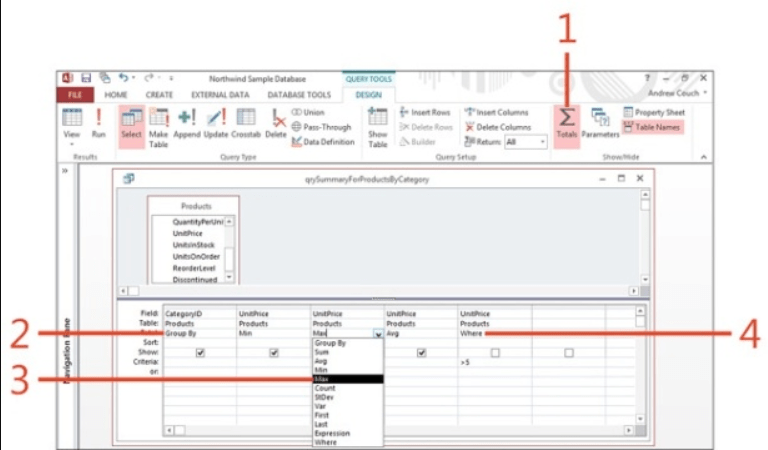
Step 6: Add Calculations or Summary Statistics (Optional)
If desired, you can include calculations or summary statistics in your report. Examples include totals, averages, counts, or other aggregate functions. To do this, click on the “Insert” tab, select the appropriate calculation function, and designate the fields to apply the calculation to.
Step 7: Preview the Report
Preview your report before finalizing any modifications. Click on the “Report View” button in the “View” tab to see how the report will look when printed or viewed by others. Make any necessary adjustments to ensure the report meets your requirements.
Step 8: Save and Share the Report
Once you are satisfied with the report’s design, save it by clicking on the “Save” button in the Quick Access Toolbar or by pressing Ctrl + S. Give the report a meaningful name and specify the location to save it. You can then share the report with others by exporting it to PDF or printing it directly from Access.
By following these step-by-step instructions, you can unlock the full potential of the Report Design feature in Microsoft Access, enhancing your data reporting capabilities and facilitating informed decision-making.
Buy cheap Microsoft Office 2021 Pro Plus for less from our web and experience top-quality software without the high price tag.