Office Blog
How do I Create Diagrams and Flowcharts in Microsoft Visio?
Microsoft Visio is a powerful tool for creating diagrams and flowcharts. With its user-friendly interface and vast library of templates and shapes, Visio makes it simple to visually represent complex ideas. Whether you’re new to Visio or need a refresher, this guide will help you get started.
1. Getting Started with Visio
Before creating your diagram or flowchart, ensure you have Microsoft Visio installed. Visio is available as part of Microsoft Office 365 or as a standalone product.
- Open Visio: Launch the application from your desktop or start menu.
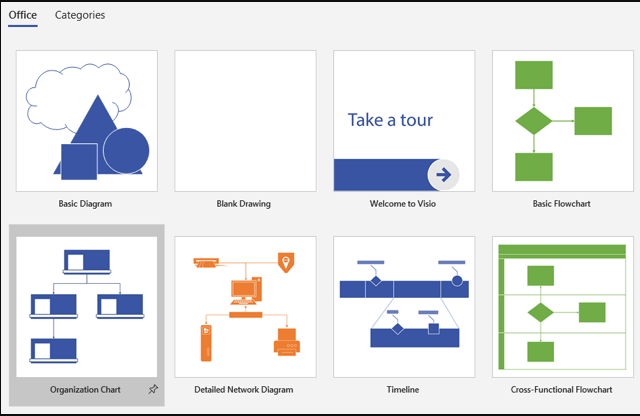
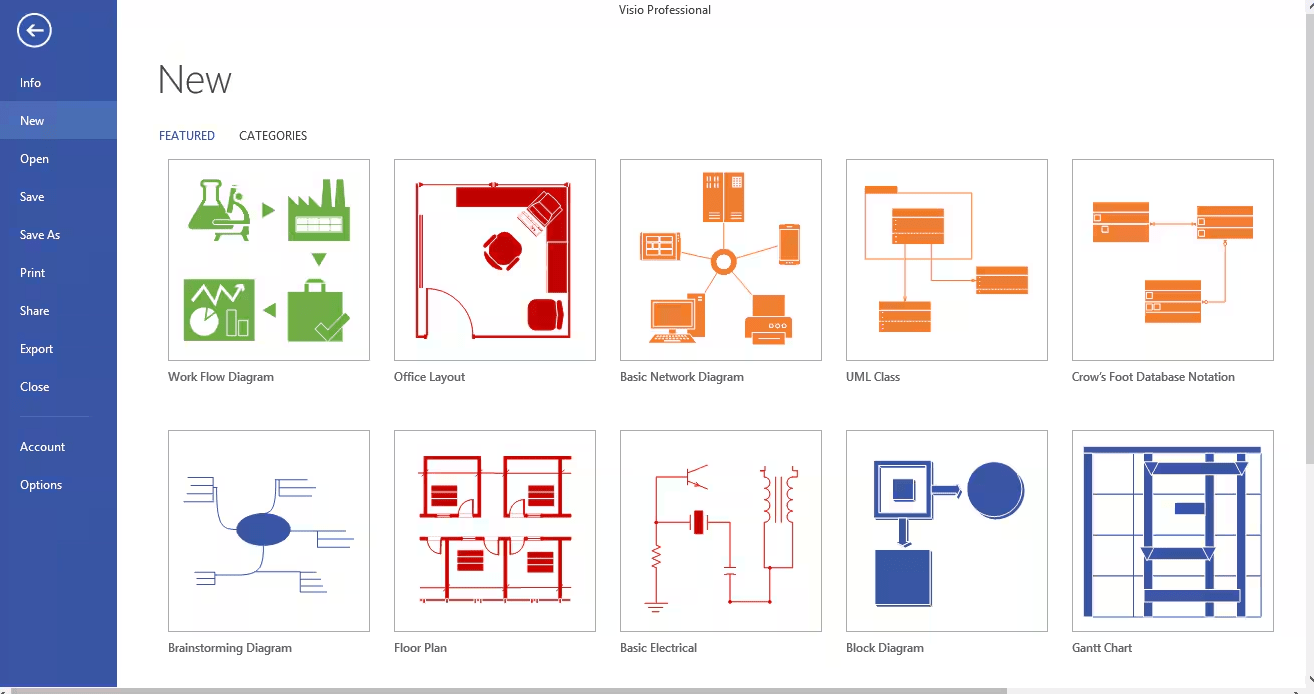
- Choose a Template: Visio provides numerous templates tailored to different diagram types. To start:
- From the home screen, browse through categories such as “Flowchart,” “Network,” or “Business.”
- Select a template that matches your needs or choose a blank canvas for full customization.
2. Creating a Flowchart
Flowcharts are among the most common diagrams in Visio. Here’s how to create one:
- Select a Flowchart Template: From the template menu, choose “Basic Flowchart” or “Cross-Functional Flowchart” for swimlane diagrams.
- Add Shapes:
- Drag shapes (e.g., rectangles for processes, diamonds for decisions) from the Shapes Pane on the left side of the screen onto your canvas.
- Arrange the shapes in the desired sequence.
- Connect Shapes:
- Use the Connector Tool from the toolbar or hover over a shape to see quick connection arrows.
- Click and drag from one shape to another to create connecting lines.
- Add Text:
- Click inside a shape or connector line to type a label or description.
- Customize Appearance:
- Use the Format tab to change colors, fonts, and styles to align with your design preferences.

3. Creating Other Diagrams
Visio supports various diagram types. Here are a few examples:
- Organizational Charts:
- Use the “Org Chart” template.
- Add employee or department names to boxes and link them hierarchically.
- Network Diagrams:
- Choose a “Network Diagram” template to visualize IT infrastructure.
- Drag and drop icons for routers, servers, and devices from specialized stencils.
- Timeline Diagrams:
- Use the “Timeline” template to showcase project schedules.
- Customize dates, milestones, and intervals.

4. Leveraging Visio’s Features
Microsoft Visio includes several features to enhance your diagrams:
- AutoConnect: Save time by automatically linking shapes with consistent spacing and alignment.
- Themes and Styles: Apply pre-designed themes to make your diagrams visually appealing.
- Data Integration:
- Link your diagram to external data sources (like Excel or SharePoint) to display live data.
- For example, update a flowchart automatically when task statuses in your spreadsheet change.
- Export Options:
- Save or export your diagram in various formats, including PDF, PNG, or as part of a PowerPoint presentation.
- Use Save As or Export options to share your work.
5. Tips for Effective Diagramming
- Keep It Simple: Avoid overcrowding. Stick to essential elements to maintain clarity.
- Use Consistent Formatting: Ensure uniform shapes, fonts, and colors for a professional look.
- Label Clearly: Each shape and connector should have concise, descriptive labels.
- Review and Share: Use Visio’s collaboration tools to gather feedback by sharing files with team members.
Get genuine Microsoft Visio keys at unbeatable prices—unlock powerful diagramming and flowchart tools without breaking the bank!

