Office Blog
Visualizing Data with Excel Charts and Graphs
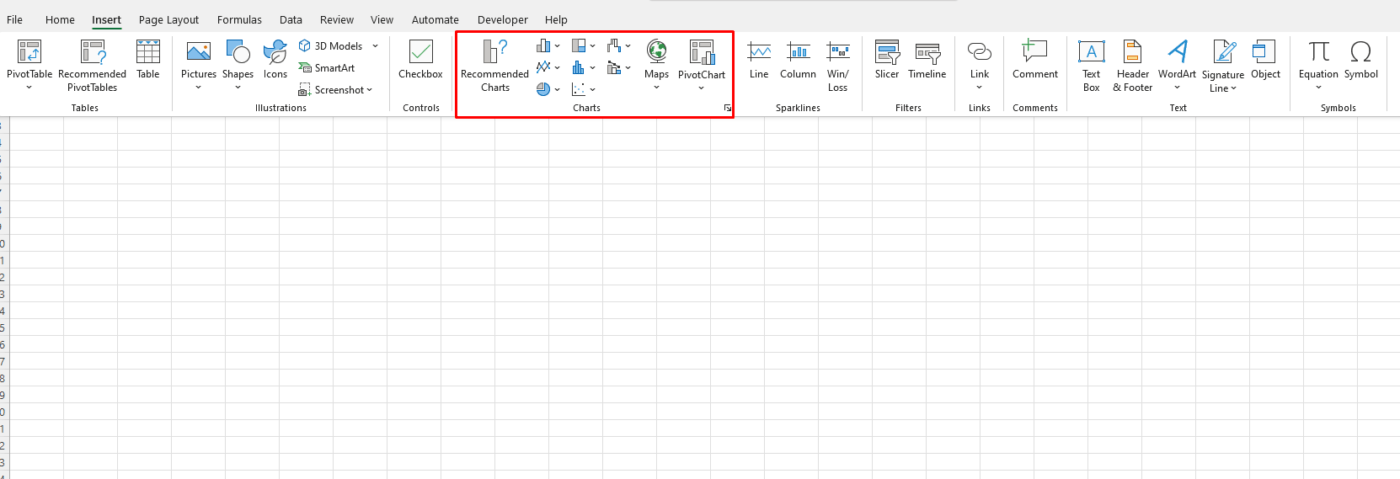
Data visualization is a powerful tool for understanding and communicating information. Excel provides a wide range of charts and graphs to help you visualize your data in a clear and meaningful way. Whether you’re working with financial data, sales reports, or survey results, using the right chart type can make your insights more accessible and easier to interpret.
Types of Excel Charts and Graphs
- Column and Bar Charts: Ideal for comparing data across categories.
- Pie Charts: Great for showing proportions and percentages.
- Line Charts: Useful for tracking trends over time.
- Scatter Plots: Help visualize relationships between two variables.
- Area Charts: Suitable for showing quantities across continuous data.

Benefits of Data Visualization in Excel
- Enhanced Understanding: Quickly identify patterns, trends, and outliers.
- Improved Decision Making: Visual data helps in making informed business decisions.
- Professional Presentation: Clear visuals are more engaging for reports and presentations.
Get genuine Microsoft Office keys at unbeatable prices—upgrade your productivity today without breaking the bank!

