Office Blog
Mastering Excel’s Data Analysis Tools for Business Insights
Excel is a powerhouse for data analysis, offering a variety of tools that can help you turn raw data into valuable business insights. Whether you’re a business analyst, a manager, or simply looking to make data-driven decisions, Excel provides features and functions that can simplify and enhance your analysis process. In this guide, we’ll explore some of Excel’s most powerful data analysis tools and how you can use them to gain deeper insights and drive better business outcomes.
1. Pivot Tables: Summarize and Analyze Large Data Sets
Pivot Tables are one of the most powerful features in Excel for summarizing, organizing, and analyzing large datasets.
- What They Do: A Pivot Table allows you to rearrange data dynamically, group it, and create reports that highlight trends, averages, totals, and more.
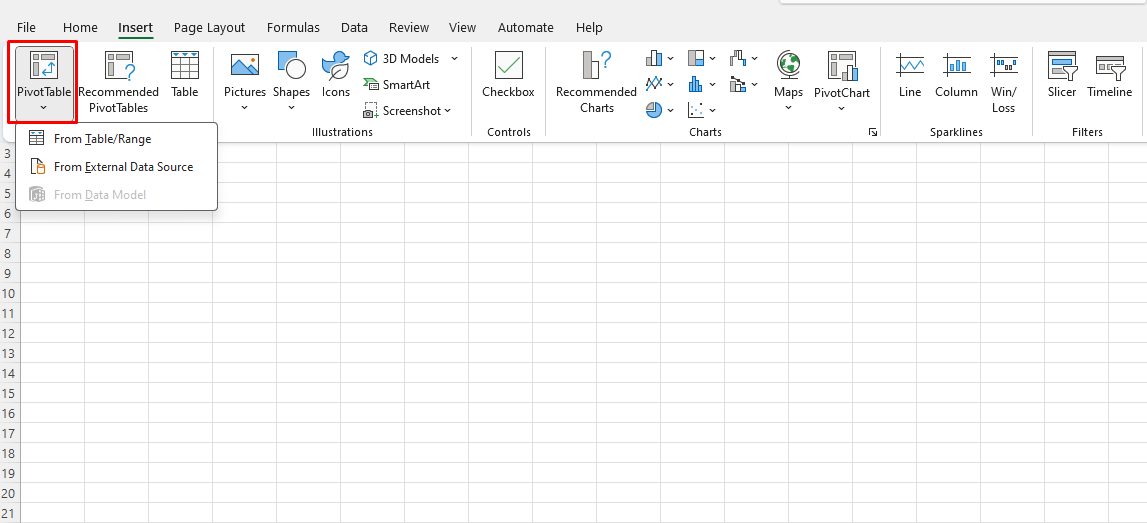
- How to Use It: Go to Insert > PivotTable, select your data range, and choose where you want the Pivot Table to appear. You can drag and drop fields to define rows, columns, and values, instantly creating a summary view of your data.
- Best For: Quick analysis of sales data, customer information, or inventory to spot patterns and insights without complex formulas.

2. Power Query: Import, Clean, and Transform Data Easily
Power Query is a data transformation tool that can import, clean, and prepare data from various sources.
- What It Does: Power Query allows you to automate data import and cleaning tasks, such as removing duplicates, splitting columns, and merging data from multiple sources.
- How to Use It: Access Power Query through the Data tab by choosing Get & Transform Data. You can select sources like databases, web pages, or other Excel files and then apply transformations.
- Best For: Automating data prep tasks, such as regular reports or combining data from multiple files, without manual effort.
3. Data Analysis ToolPak: Access Built-In Statistical Tools
The Data Analysis ToolPak is an Excel add-in that provides advanced statistical analysis capabilities.
- What It Does: This add-in offers tools for descriptive statistics, regression, t-tests, ANOVA, and more.
- How to Use It: Go to File > Options > Add-Ins and enable the ToolPak. Once activated, you’ll find the Data Analysis option in the Data tab. You can select the type of analysis, input the data range, and customize options to get your results.
- Best For: Performing statistical analysis on survey results, financial data, or other datasets where in-depth metrics and testing are needed.
4. Conditional Formatting: Highlight Key Insights Quickly
Conditional Formatting is a visual tool that applies color codes, icons, or bars to highlight specific data based on conditions.
- What It Does: By setting rules, you can make trends, anomalies, or critical data points stand out visually.
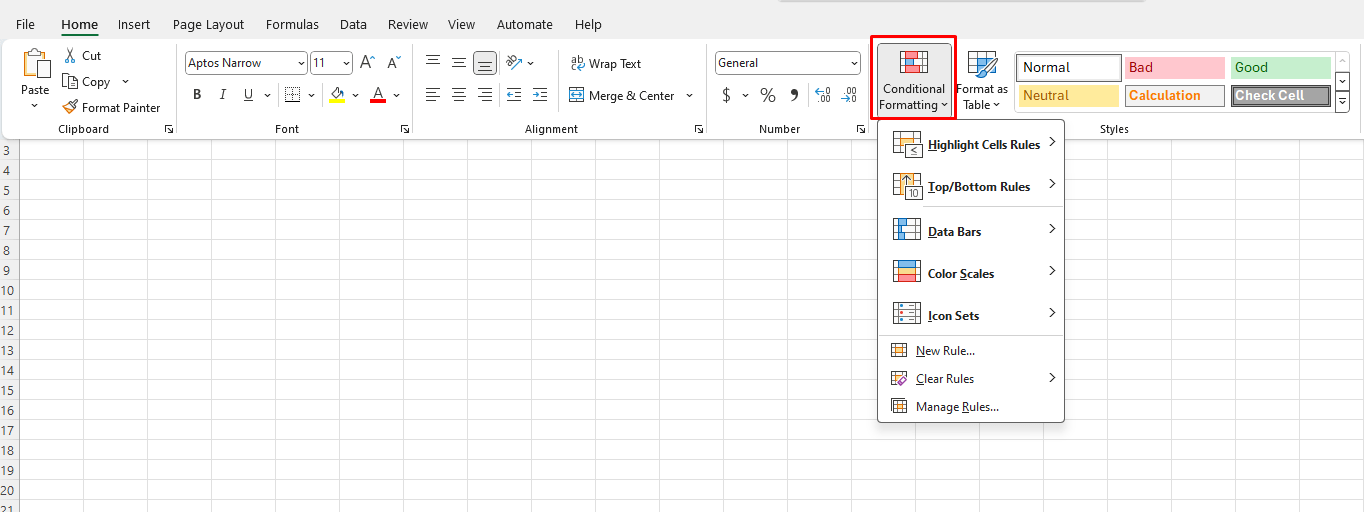
- How to Use It: Select your data range, go to Home > Conditional Formatting, and choose a rule type, such as highlighting cells based on values, applying data bars, or adding color scales.
- Best For: Spotting trends, identifying outliers, and visually grouping similar data points in performance reports or sales data.

5. Power Pivot: Analyze Data from Multiple Tables
Power Pivot is an advanced feature that enables you to analyze data from multiple tables, create data models, and use advanced calculations.
- What It Does: Power Pivot allows you to create relationships between tables, create calculated fields, and perform more complex data analysis.
- How to Use It: Activate Power Pivot by going to File > Options > Add-Ins. Once enabled, you’ll find it in the Data tab. You can import tables and define relationships without complex lookups.
- Best For: Comprehensive data models, financial analysis, and working with large datasets that require relationships across tables, such as customer and sales databases.
6. Goal Seek: Make Data-Driven Decisions with “What-If” Analysis
Goal Seek is part of Excel’s suite of what-if analysis tools, which can help you forecast and make decisions by adjusting input values to achieve a desired outcome.
- What It Does: Goal Seek allows you to set a target value for a formula and then adjusts one of the variables to meet that goal.
- How to Use It: Go to Data > What-If Analysis > Goal Seek. Specify the cell with the formula, the target value, and the cell to change. Excel will adjust the variable to achieve the goal.
- Best For: Financial forecasting, break-even analysis, and determining pricing strategies or sales goals based on specific targets.

7. Data Validation: Maintain Data Quality and Consistency
Data Validation is an essential tool for setting rules on what type of data can be entered into specific cells.
- What It Does: By setting data validation rules, you can ensure that users enter data correctly, such as dates within a range or selections from a list.
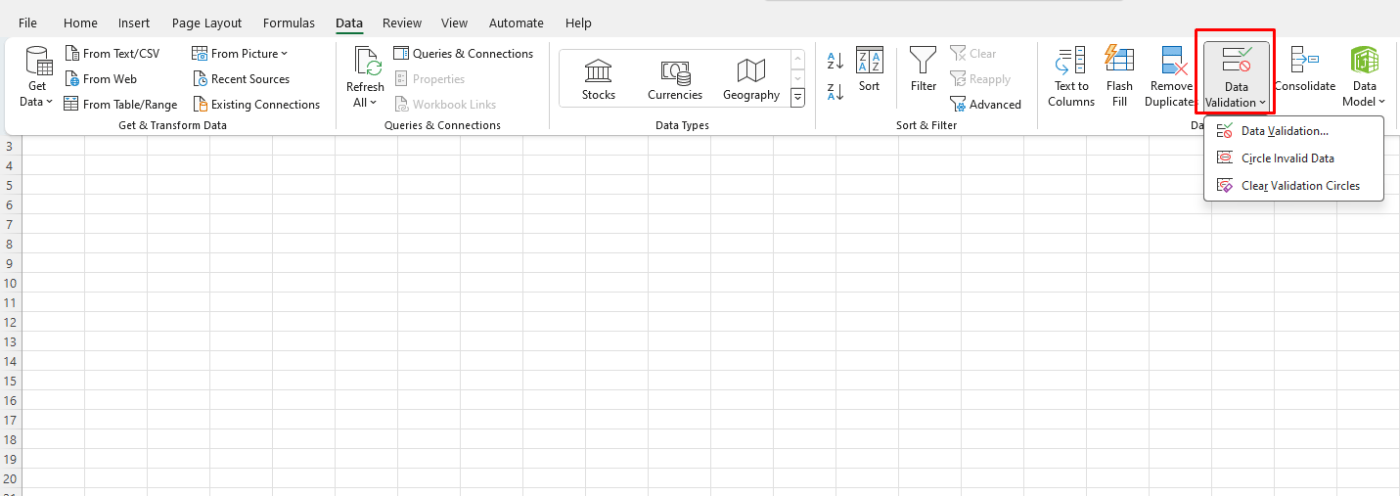
- How to Use It: Select the cells, go to Data > Data Validation, and choose criteria, such as lists, numbers, dates, or custom formulas.
- Best For: Ensuring data accuracy in reports, standardizing entries in large spreadsheets, and preventing errors in shared documents.

Unlock the full Microsoft Office experience with the cheapest Office Keys available on our website—get productivity at unbeatable prices!

