
Office Blog
Master PowerPoint’s SmartArt for Better Visuals

PowerPoint is not just about adding text and images to slides; it’s about creating a dynamic and visually appealing presentation that engages your audience. One of the most powerful, yet often underused, tools in PowerPoint is SmartArt. This feature allows you to present complex ideas and data in visually attractive formats, turning ordinary slides into compelling stories.
In this blog post, we’ll dive into PowerPoint’s SmartArt and show you how to harness its potential for better visuals, clear communication, and impactful presentations.
What is SmartArt in PowerPoint?
SmartArt is a powerful tool in PowerPoint that allows you to represent ideas, processes, hierarchies, and relationships with various pre-designed diagrams. Whether you’re presenting a timeline, process flow, comparison, or organizational chart, SmartArt offers a quick, professional way to add structure and clarity to your slides.
SmartArt allows you to:
- Visualize Data: Simplify complex concepts by transforming text into graphical elements.
- Improve Clarity: Make your ideas easier to understand with visual representation.
- Enhance Design: Elevate the visual appeal of your slides with polished, structured layouts.
How to Use SmartArt in PowerPoint
Here’s a simple guide to get you started with SmartArt in PowerPoint:
Step 1: Insert SmartArt
- Open your PowerPoint presentation and go to the slide where you want to add SmartArt.
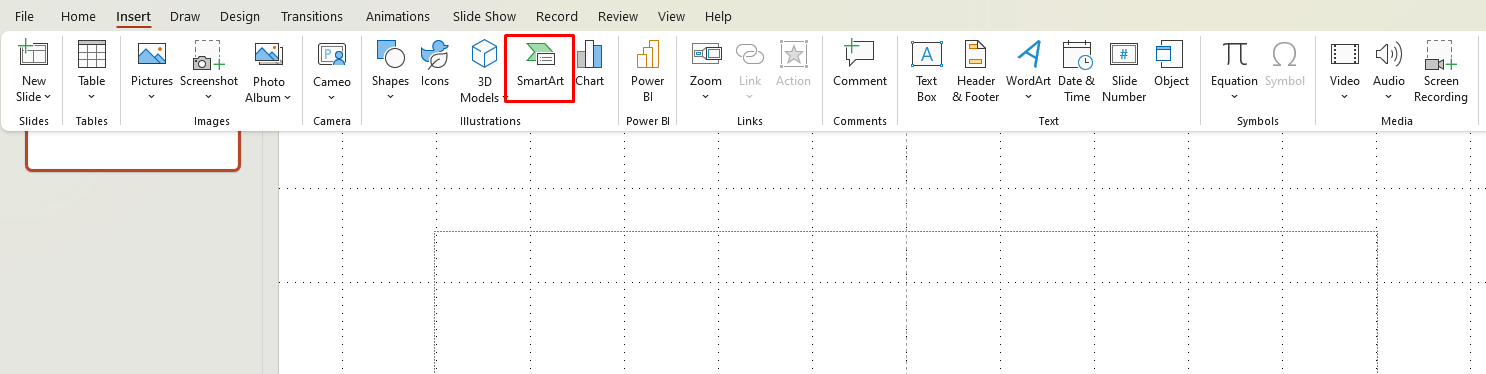
- Click on the Insert tab in the ribbon.
- Select SmartArt from the dropdown menu.
- A SmartArt Gallery will appear, offering a wide variety of graphic types to choose from.
Step 2: Choose the Right Graphic
PowerPoint offers many SmartArt graphics divided into categories such as:
- List: For bullet-point lists or step-by-step processes.
- Process: Ideal for visualizing processes and workflows.
- Cycle: Perfect for displaying cyclical or continuous processes.
- Hierarchy: Great for showing organizational charts or levels.
- Relationship: Used to represent connections or comparisons.
- Matrix: For displaying relationships between multiple elements.
- Pyramid: For representing hierarchical relationships or priorities.
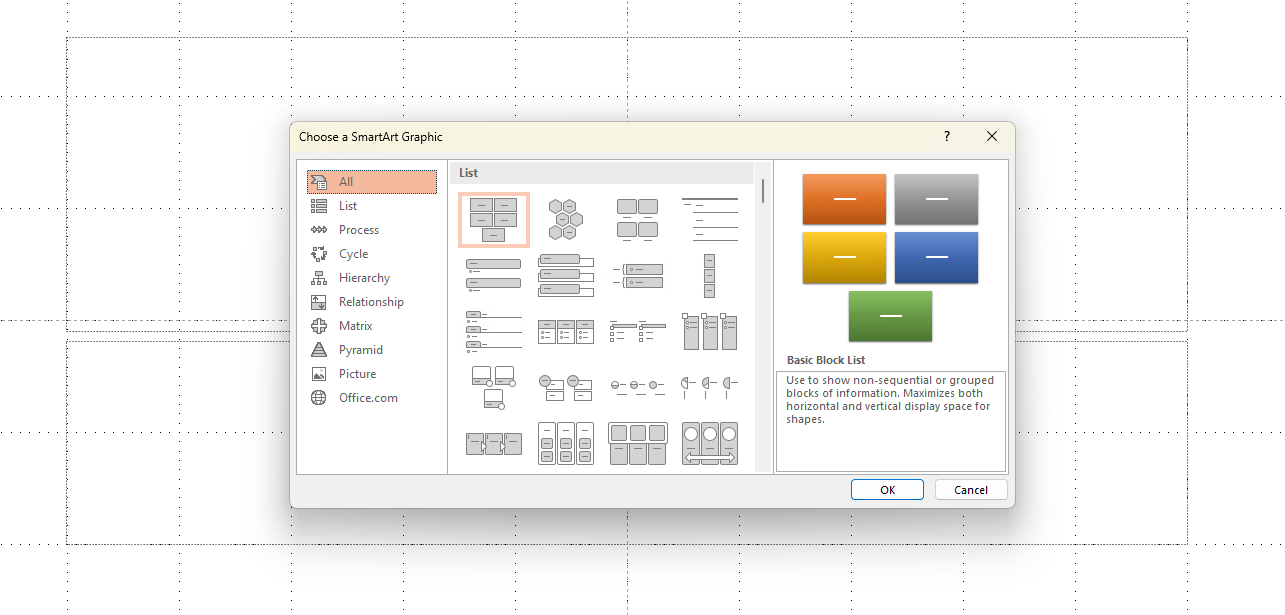
Choose the SmartArt graphic that best fits the message you want to convey.
Step 3: Add Text to Your SmartArt
After selecting a SmartArt graphic, you can enter your content by clicking on the text pane that appears. You can add text directly to each shape or use the Text Pane on the left side for bulk text input. If you prefer, you can click inside the shapes and start typing.
Step 4: Customize and Style Your SmartArt
Once your content is in place, customize the look and feel of the SmartArt by:
- Changing Colors: PowerPoint offers various color schemes under SmartArt Styles to help match your branding.
- Adding Effects: Add depth or shadow effects to make your graphics stand out.
- Modifying Layouts: You can adjust the size, spacing, and positioning of your SmartArt elements.
- Changing Shapes: You can convert shapes to different types for better visual appeal.
Step 5: Animate Your SmartArt
To add dynamic movement to your SmartArt, go to the Animations tab and select an animation style for your graphic. Animating your SmartArt can add extra engagement and ensure your audience stays focused.
Tips for Mastering SmartArt in PowerPoint
🎨 Choose Simplicity Over Complexity
While it might be tempting to use intricate graphics, it’s often best to stick with simple layouts that allow your content to shine. A clean, minimalistic design ensures that your audience can focus on the message rather than getting distracted by overly complex visuals.
🔄 Be Consistent with Style
Consistency is key in presentation design. Stick to similar styles for all your SmartArt elements to ensure a cohesive look throughout the slide deck. This includes maintaining the same color scheme, font style, and graphic layout.
🖼 Use SmartArt with Images for a Stronger Visual Impact
Combine your SmartArt with high-quality images or icons. For instance, if you’re creating a process flow, add relevant icons to each step to provide a visual context that complements the text.
✍ Edit SmartArt After Insertion
If you need to make adjustments after inserting the SmartArt graphic, you can always edit the text or shapes. Simply click on the SmartArt graphic and use the Design and Format tabs to tweak the content.
📊 SmartArt for Data Visualization
PowerPoint’s SmartArt is especially useful for visualizing data. Use SmartArt to turn lists of bullet points into more engaging visuals, or to represent relationships between different data points.
Get the best deals on the cheapest Office keys, offering genuine licenses at unbeatable prices for your software needs!