Office Blog
How to Work with Large Data Sets in Excel?
Managing large data sets in Excel can be overwhelming, but with the right strategies and tools, you can handle even the most massive datasets with ease. Excel is packed with features designed to help you organize, analyze, and visualize large volumes of data efficiently. Whether you’re working with sales figures, customer data, or complex financial records, this guide will help you unlock Excel’s full potential for managing large data sets.
1. Organize Your Data Properly
Before jumping into analysis, it’s essential to ensure your data is structured in a way that makes it easy to work with:
- Use Tables: Convert your data range into an Excel Table (Insert > Table). This allows for automatic expansion, easy filtering, and better management of data.
- Label Columns Clearly: Give each column a clear and descriptive header. This is crucial when working with large data sets to avoid confusion.
- Avoid Blank Rows and Columns: Keep your data continuous. Excel will treat blank rows or columns as the end of a data set, which may limit your analysis.
2. Use Excel’s Built-In Data Tools
Excel offers several powerful tools that can make working with large data sets easier:
Filter and Sort
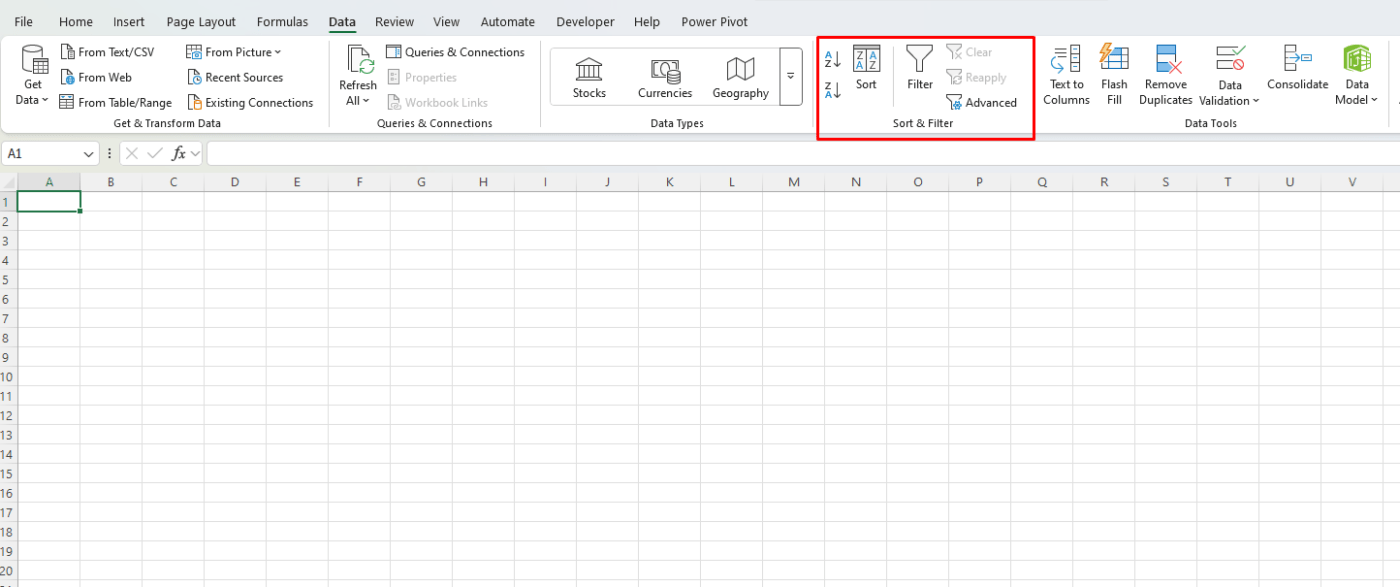
- Filter: Go to the Data tab and click on Filter to add drop-down menus to each column header. This allows you to quickly sort or filter data based on specific criteria.
- Sort: Sorting your data alphabetically or numerically can help you make sense of large amounts of information.

Text to Columns
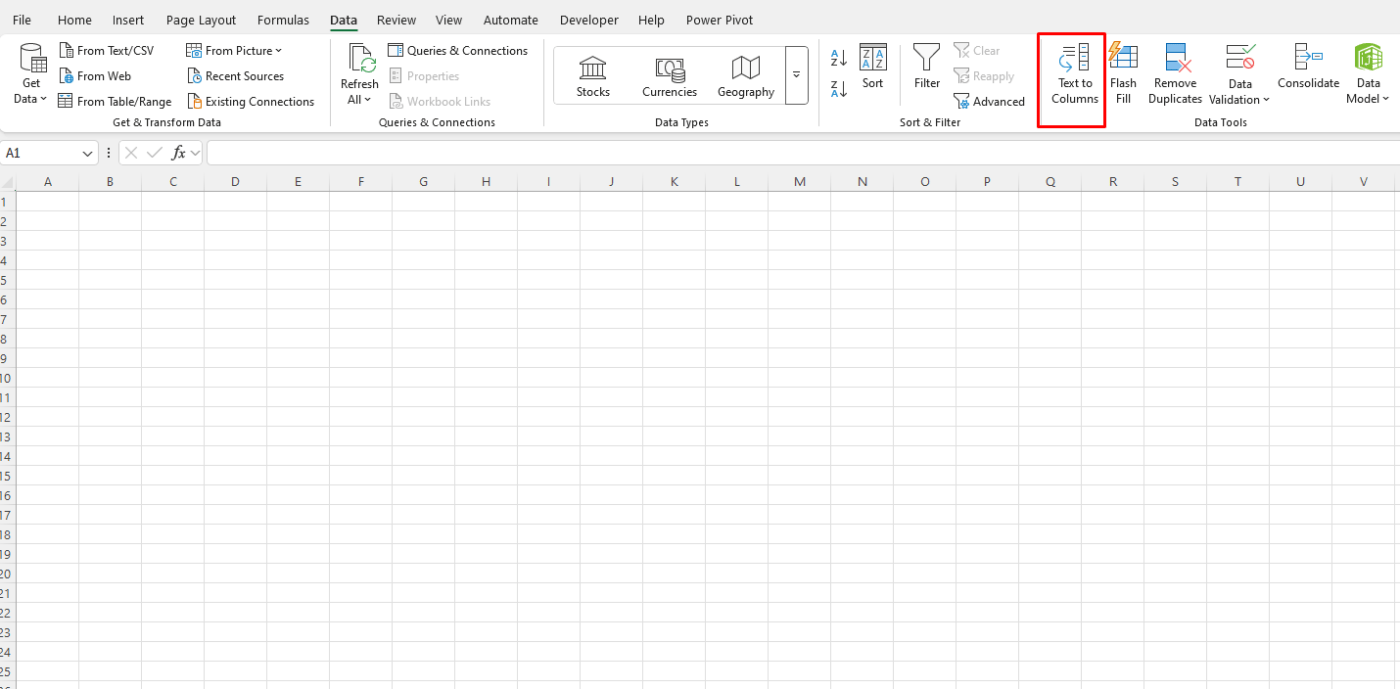
If your data is combined into a single column (e.g., names and addresses), use the Text to Columns tool to split it into multiple columns based on delimiters like commas or spaces.
- Go to the Data tab, select Text to Columns, and choose your delimiter.

3. Use Pivot Tables for Summarizing Data
Pivot Tables are one of the most efficient ways to summarize large data sets. They allow you to reorganize, group, and filter data dynamically to highlight important trends and insights:
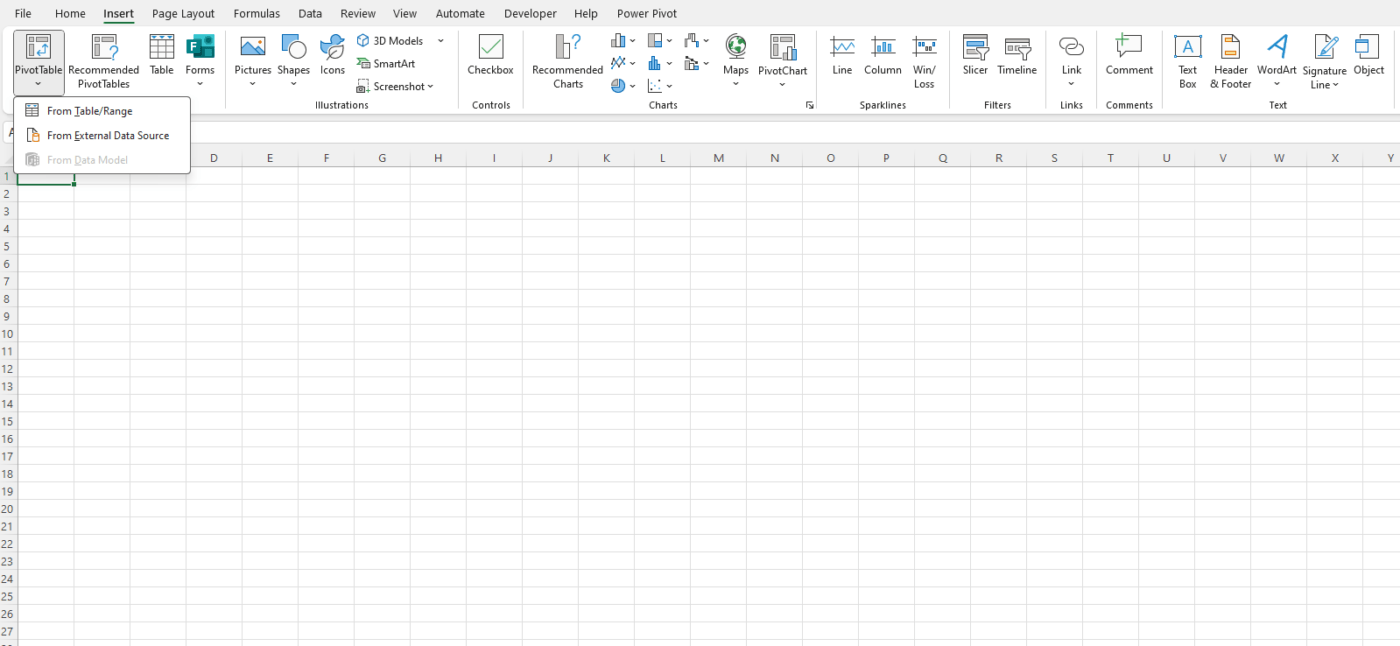
- Select your data range and go to Insert > Pivot Table.
- Drag fields into Rows, Columns, and Values to summarize the data.
- Use Filters and Slicers to further analyze the data.

Pro Tip:
You can create multiple Pivot Tables from the same data set and link them with slicers, making it easy to compare different segments of your data.
4. Leverage Excel’s Power Query
Power Query is a powerful tool for importing, cleaning, and transforming large data sets before loading them into Excel. It allows you to automate repetitive tasks like removing duplicates, filtering data, and reshaping tables:
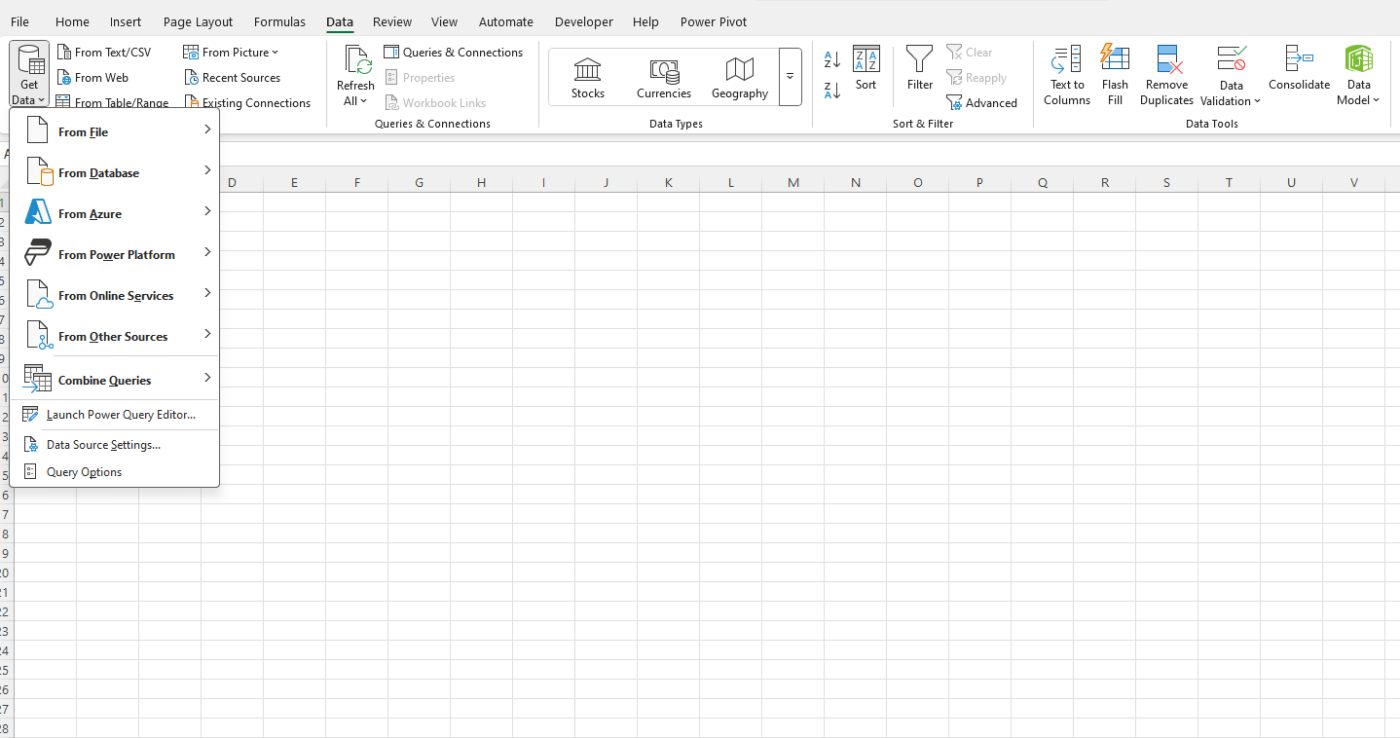
- Go to Data > Get Data and choose your data source (CSV, database, web, etc.).
- Use the Power Query Editor to filter, sort, and clean your data.
- Load the cleaned data back into Excel for analysis.

5. Work with Dynamic Arrays
Excel’s dynamic arrays allow you to perform calculations and extract data dynamically across large ranges. Functions like FILTER, SORT, and UNIQUE allow you to manipulate large data sets with ease without having to manually update formulas.
Examples:
- FILTER:
=FILTER(A2:A100, B2:B100="Yes") - SORT:
=SORT(A2:C100) - UNIQUE:
=UNIQUE(A2:A100)
Dynamic arrays update automatically as your data changes, making them ideal for working with large data sets.
6. Optimize Excel’s Performance
Large data sets can slow down Excel, making it harder to work efficiently. Here are some tips to optimize performance:
- Disable Automatic Calculations: Under Formulas > Calculation Options, set Excel to manual calculation. This prevents Excel from recalculating every time you make a change, which can slow things down.
- Use 64-Bit Excel: If you frequently work with large data sets, consider using the 64-bit version of Excel, which can handle larger files and more complex operations.
- Limit the Use of Volatile Functions: Functions like OFFSET, INDIRECT, and NOW can slow down your workbook when working with large data. Use them sparingly.
Get the cheapest Office Keys online and unlock premium productivity tools at unbeatable prices!

