
Office Blog
How to Use Excel’s Forecasting Tools Like a Pro?

Forecasting is a crucial aspect of business planning, whether you’re projecting sales, financial performance, or inventory levels. Luckily, Excel provides powerful forecasting tools that can help you make data-driven predictions. In this guide, we’ll explore how to leverage Excel’s forecasting tools to make accurate projections and boost your decision-making.
1. Introduction to Excel’s Forecasting Features
Excel offers a range of forecasting tools that are accessible, even for beginners. These tools can analyze historical data to predict future trends, helping businesses anticipate changes and optimize operations.
Some of the key forecasting functions in Excel include:
- FORECAST.LINEAR
- FORECAST.ETS
- The Forecast Sheet Feature
2. Using the FORECAST.LINEAR Function
The FORECAST.LINEAR function is one of the most commonly used tools for simple linear forecasting. It predicts a future value based on historical data. For example, if you’re trying to forecast sales for the next quarter, you can use this function to estimate the value based on the trend of previous data.
Syntax:
=FORECAST.LINEAR(x, known_ys, known_xs)Where:
x= the data point for which you want to predict the valueknown_ys= the range of dependent values (e.g., past sales figures)known_xs= the range of independent values (e.g., time periods)
Example:
To predict the sales for the next month based on the past 6 months:
=FORECAST.LINEAR(7, B2:B7, A2:A7)This assumes you have sales data from months 1 to 6 in cells B2:B7 and months 1 to 6 in cells A2:A7.
3. Exploring FORECAST.ETS for Time-Based Predictions
The FORECAST.ETS function is more advanced and is useful for data that exhibits seasonality. It’s designed for forecasting based on historical time series data and can handle trends, seasonal patterns, and cycles.
Syntax:
=FORECAST.ETS(target_date, values, timeline, [seasonality], [data_completion], [aggregation])Where:
target_date= the future time period you want to forecastvalues= the historical data to base the forecast ontimeline= the corresponding time periods for the historical data[seasonality]= optional argument to define the seasonality of the data[data_completion]and[aggregation]= optional arguments to handle missing data and how data should be aggregated
Example:
To forecast sales for the next month based on seasonal sales data:
=FORECAST.ETS(A8, B2:B7, A2:A7)Where A8 is the date you want to forecast, B2:B7 contains the sales data, and A2:A7 has the corresponding time periods.
4. The Forecast Sheet Feature: A One-Click Solution
For those who prefer a visual approach, Excel offers a built-in Forecast Sheet feature that automatically generates a forecast chart based on your data. This tool is a great choice if you’re looking for quick insights without diving into formulas.
How to Create a Forecast Sheet:
- Select your historical data (including time periods and values).
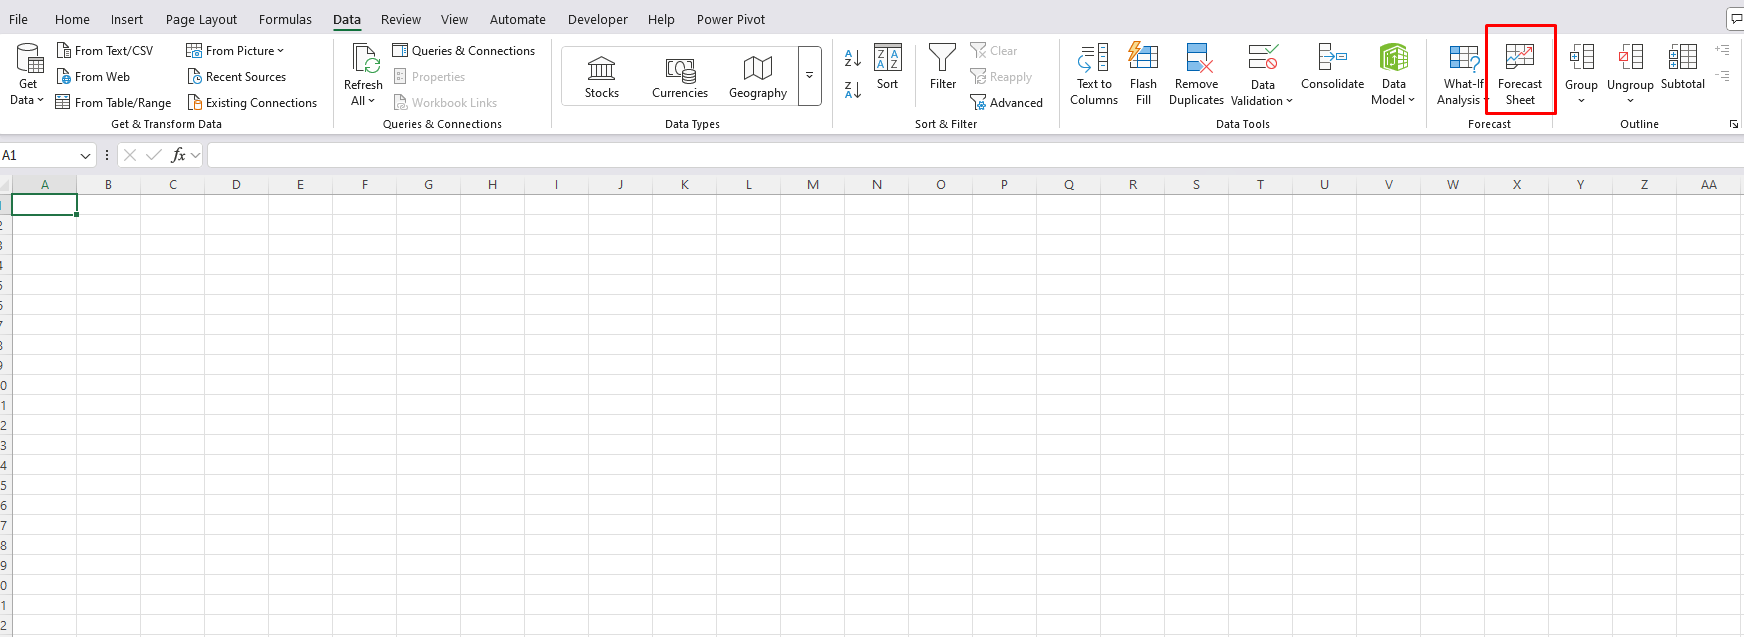
- Go to the Data tab on the ribbon.
- In the Forecast group, click on Forecast Sheet.
- Choose either a line chart or a column chart for the forecast.
- Adjust any options such as seasonality and confidence intervals.
- Click Create to generate the forecast chart.
Excel will automatically create a forecast with predictions, including a confidence range to show potential variability in your projections.
5. Interpreting Forecast Results
Once you’ve used Excel’s forecasting tools, it’s important to understand the results. When using FORECAST.LINEAR, you get a direct prediction for future data points. However, FORECAST.ETS includes a confidence interval to give you an idea of how reliable the forecast is.
- High Confidence Interval: This means the forecast is relatively certain, with minimal variation expected.
- Low Confidence Interval: This indicates greater uncertainty and suggests the forecast is more likely to deviate from actual outcomes.
6. Best Practices for Accurate Forecasting in Excel
To ensure you get the most accurate forecast possible, follow these best practices:
- Use clean, consistent data: Inconsistent or missing data can skew results, so make sure your historical data is accurate.
- Understand seasonality: If your data is seasonal, always use FORECAST.ETS for better accuracy.
- Regularly update forecasts: Business conditions change, so it’s crucial to regularly update your forecasts with the latest data.
- Test different models: If unsure about which method to use, try different forecasting functions to see which one gives the best results for your data.
Get the cheapest Office Keys at unbeatable prices—genuine, fast delivery, and 100% activation guaranteed!