
Office Blog
Convert Boring Data into Engaging PowerPoint Charts

When it comes to presenting data in PowerPoint, we’ve all seen those tedious slides filled with rows of numbers, or worse, an overwhelming sea of text. Let’s face it: data-heavy slides can often turn a potentially engaging presentation into something more dull and hard to follow. But, the good news is that PowerPoint offers a variety of tools to help you convert boring data into dynamic and engaging charts that captivate your audience’s attention.
In this blog, we’ll explore how you can take those dry figures and turn them into visually appealing and informative PowerPoint charts that make your message not only clearer but more memorable.
Why Charts Matter in PowerPoint Presentations
When you’re dealing with data-heavy presentations, the goal is to not only share information but to make that information understandable and engaging. Charts are an excellent tool for this, as they:
- Simplify complex information: Data can be overwhelming, but a well-designed chart makes trends, comparisons, and relationships clear.
- Highlight key insights: A chart draws attention to important data points, ensuring that your audience focuses on what really matters.
- Enhance visual appeal: Adding charts breaks up the monotony of text-heavy slides and makes your presentation look polished and professional.
- Increase retention: Visuals help people retain information better than plain numbers alone. A well-designed chart helps your audience remember your message.
Step-by-Step Guide to Creating Engaging PowerPoint Charts
Let’s dive into how you can use PowerPoint’s built-in chart tools to create visually appealing and informative charts that highlight your data in an engaging way.
Step 1: Choose the Right Type of Chart
Choosing the right chart type is critical to effectively communicating your data. PowerPoint offers a wide range of chart types, each serving different purposes:
Column Chart
Great for comparing categories or showing trends over time. Use column charts when you want to compare multiple categories or track changes over time.
Line Chart
Perfect for showing continuous data and trends. A line chart is ideal for visualizing how things change over a period of time.
Pie Chart
Use pie charts to show parts of a whole. They work best for percentage breakdowns or when you want to show proportions.
Bar Chart
Similar to column charts, but horizontal. Bar charts are useful when you have long category labels and want to compare relative sizes of categories.
Scatter Plot
Ideal for showing correlations or relationships between variables. If you’re showcasing patterns or correlations, scatter plots are a great choice.
Area Chart
Use area charts to show the magnitude of change over time and how different series contribute to a total. They’re good for displaying cumulative data.
Pro Tip: Don’t use a pie chart when you have more than 5 or 6 data points—it can get messy. Stick to column, bar, or line charts for more than 6 categories.

Step 2: Customize Your Chart for Visual Appeal
Once you’ve selected the chart type, it’s time to customize it. Here are some tips to make your chart visually appealing:
1. Choose an Eye-Catching Color Scheme
PowerPoint offers a variety of built-in color themes, but customizing the color palette can make your chart stand out even more. Use contrasting colors to highlight key data points and ensure your chart is easy to read. Just make sure the colors you choose are visually harmonious and don’t overwhelm the audience.
2. Add Data Labels
Including data labels on your chart can help the audience quickly understand the values behind the chart without having to look back at your table. Just be careful not to clutter the chart—selective labeling is key.
3. Keep It Simple with Clear Axis Labels
Make sure that your x-axis and y-axis are clearly labeled. You can also add a chart title to explain the key insight. Avoid overloading the chart with extra information—just highlight the key numbers and trends.
4. Use Legends and Titles
Make sure to label your chart’s sections clearly. Legends can help explain multiple data series, and titles can give context to what the chart represents. Keep these elements concise and focused.
5. Adjust Chart Size and Layout
Ensure that your chart fits the layout of your slide. Don’t crowd your slide with a chart that’s too large or too small. Make sure there’s enough white space around the chart to ensure it stands out without overwhelming the slide.
Step 3: Add Animations for Visual Impact
PowerPoint allows you to animate your charts to make them even more dynamic and engaging. Animations can help introduce data points one by one, keeping the audience focused and giving you more control over the flow of the presentation.
1. Animating Elements of Your Chart
You can animate elements like the bars, columns, or lines of the chart to appear one at a time. This is particularly useful if you want to walk your audience through the data step by step.
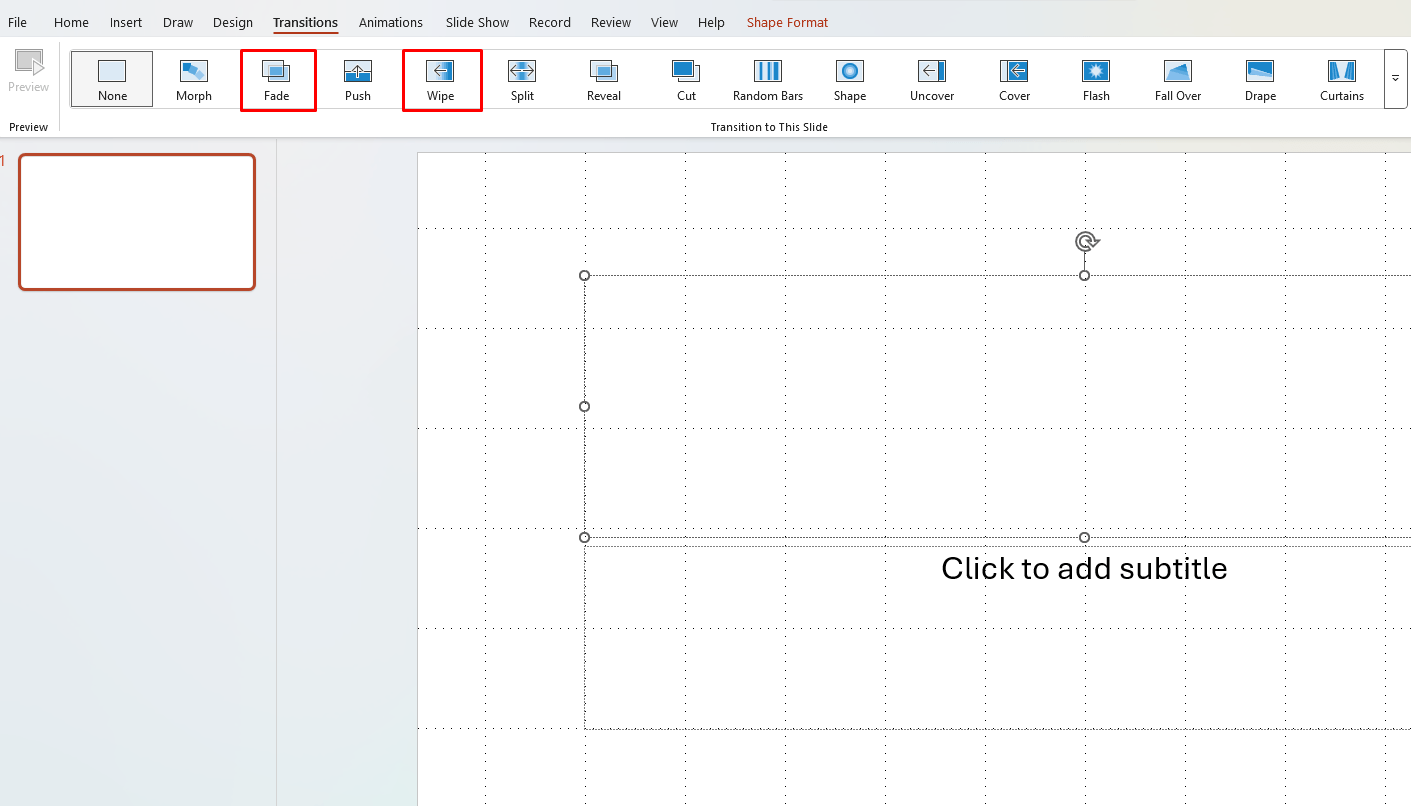
2. Use “Wipe” or “Fade” Effects
The wipe animation is perfect for column charts or line charts, as it makes the data appear progressively, simulating a graph’s growth. Fade animations work well when you want to add a smooth, gradual transition.
Step 4: Integrate Interactive Features
For even more interactivity, you can make your charts clickable. This is a great option for interactive presentations where your audience can choose what data to see next.
1. Create Hyperlinks within Charts
Link different charts or sections of your presentation to each other. For example, if you’re presenting several different sales figures, you could allow your audience to click through and explore each chart in detail. This makes your presentation feel like an interactive dashboard.
2. Embed Real-Time Data
For presentations that require up-to-date data, you can embed Excel data into your PowerPoint charts. This allows the data to be automatically updated when you change the Excel file, ensuring that your charts always reflect the most current information.
Step 5: Make Your Charts Tell a Story
Data in a chart is great, but data without context can be meaningless. Always strive to tell a story with your charts. Use your data to support your main points and drive home key messages. For example, if you’re showing sales growth, focus on highlighting the trend rather than showcasing every minor fluctuation.
You can also use annotations in your charts to highlight important trends or key takeaways. Use arrows or text boxes to guide the audience’s attention to the most critical data points.
Get the best deals on Office keys with our unbeatable prices—genuine licenses at the lowest cost guaranteed!