
Office Blog
Create a Dynamic Gantt Chart in Excel Easily

Managing projects efficiently requires clear visual tracking of tasks, deadlines, and milestones. One of the most effective ways to visualize project timelines is through a Gantt chart, which displays tasks over time in a horizontal bar chart format. While there are specialized tools for creating Gantt charts, Excel offers a straightforward way to build a dynamic Gantt chart without the need for additional software. In this blog, we’ll guide you through creating a dynamic Gantt chart that updates automatically as your project data changes.
What is a Gantt Chart?
A Gantt chart is a bar chart that represents a project schedule. It shows the start and end dates of tasks, their duration, and how they relate to each other over time. In a Gantt chart, the tasks are listed on the left side, and a timeline runs horizontally at the top. The bars that correspond to each task’s duration are placed across the timeline.
By using a Gantt chart, project managers can easily track the progress of their projects, allocate resources, and ensure tasks are completed on time.
Step 1: Prepare Your Data
To create a Gantt chart in Excel, you first need to organize your project data. Let’s assume you have a list of tasks with their start dates and end dates. Here’s how you can set up your data:
| Task Name | Start Date | End Date | Duration (Days) |
|---|---|---|---|
| Task 1 | 01/01/2025 | 01/07/2025 | 7 |
| Task 2 | 01/04/2025 | 01/10/2025 | 7 |
| Task 3 | 01/06/2025 | 01/14/2025 | 9 |
| Task 4 | 01/08/2025 | 01/15/2025 | 8 |
Explanation of Columns:
- Task Name: The name of the task.
- Start Date: The date when the task begins.
- End Date: The date when the task is due to finish.
- Duration (Days): The total number of days the task will take, calculated as:
Duration = End Date – Start Date
Step 2: Insert a Stacked Bar Chart
Next, we’ll use Excel’s Stacked Bar Chart feature to create the basic structure of the Gantt chart. Here’s how to do it:
- Highlight Your Data: Select the Start Date and Duration columns (not including task names).
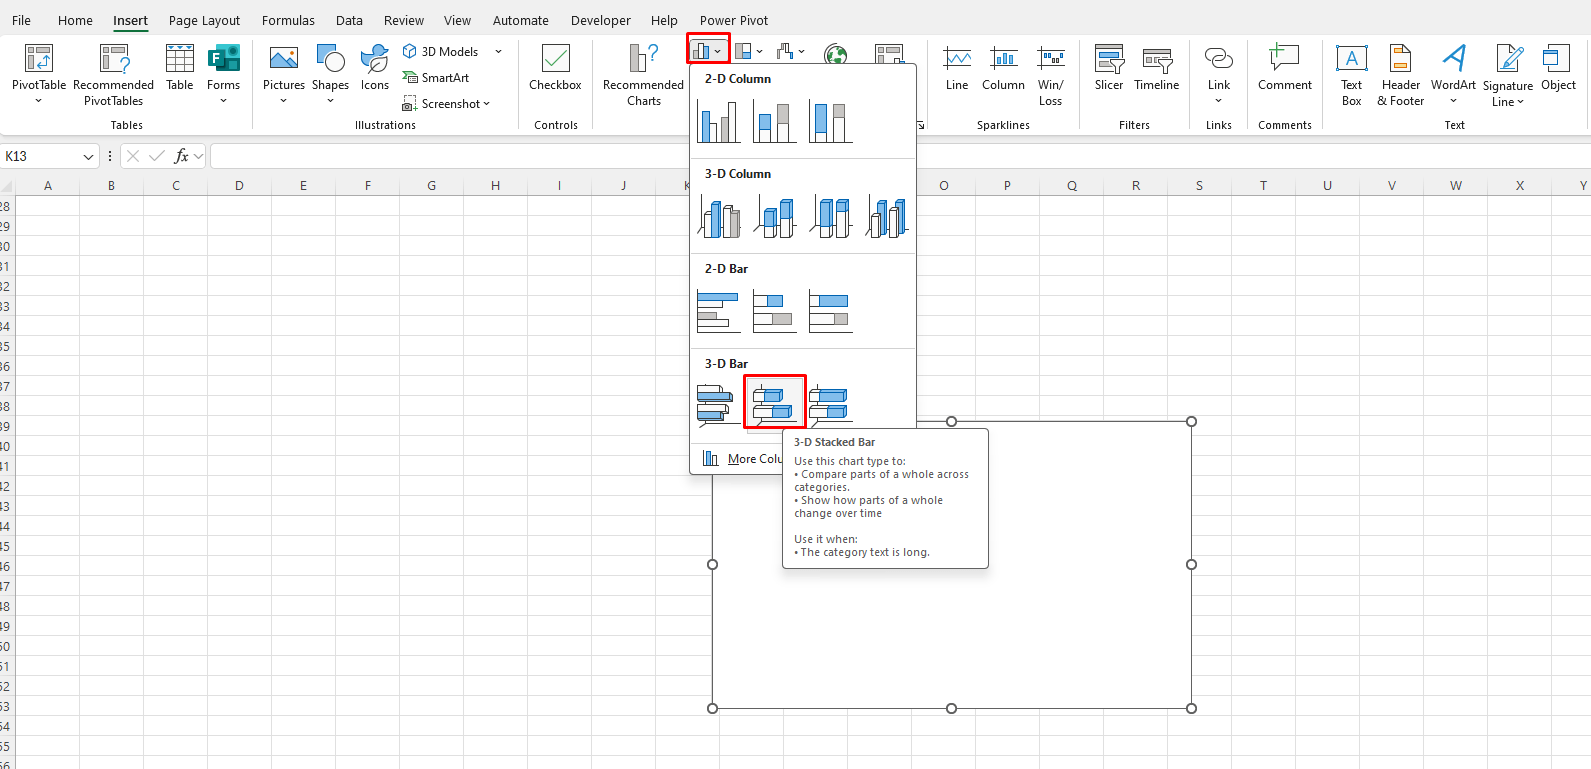
- Insert a Stacked Bar Chart: Go to the Insert tab in the ribbon, select Bar Chart, and choose Stacked Bar Chart.
- This creates a basic bar chart with both the start date and duration stacked for each task. But we’ll refine it further.
Step 3: Format the Chart to Create a Gantt Chart
Now, let’s turn this bar chart into a Gantt chart by adjusting the data series and formatting the chart.
A. Remove the Start Date Bars
The first step is to make the Start Date bars invisible so they don’t clutter the chart.
- Click on any Start Date bar (the first series).
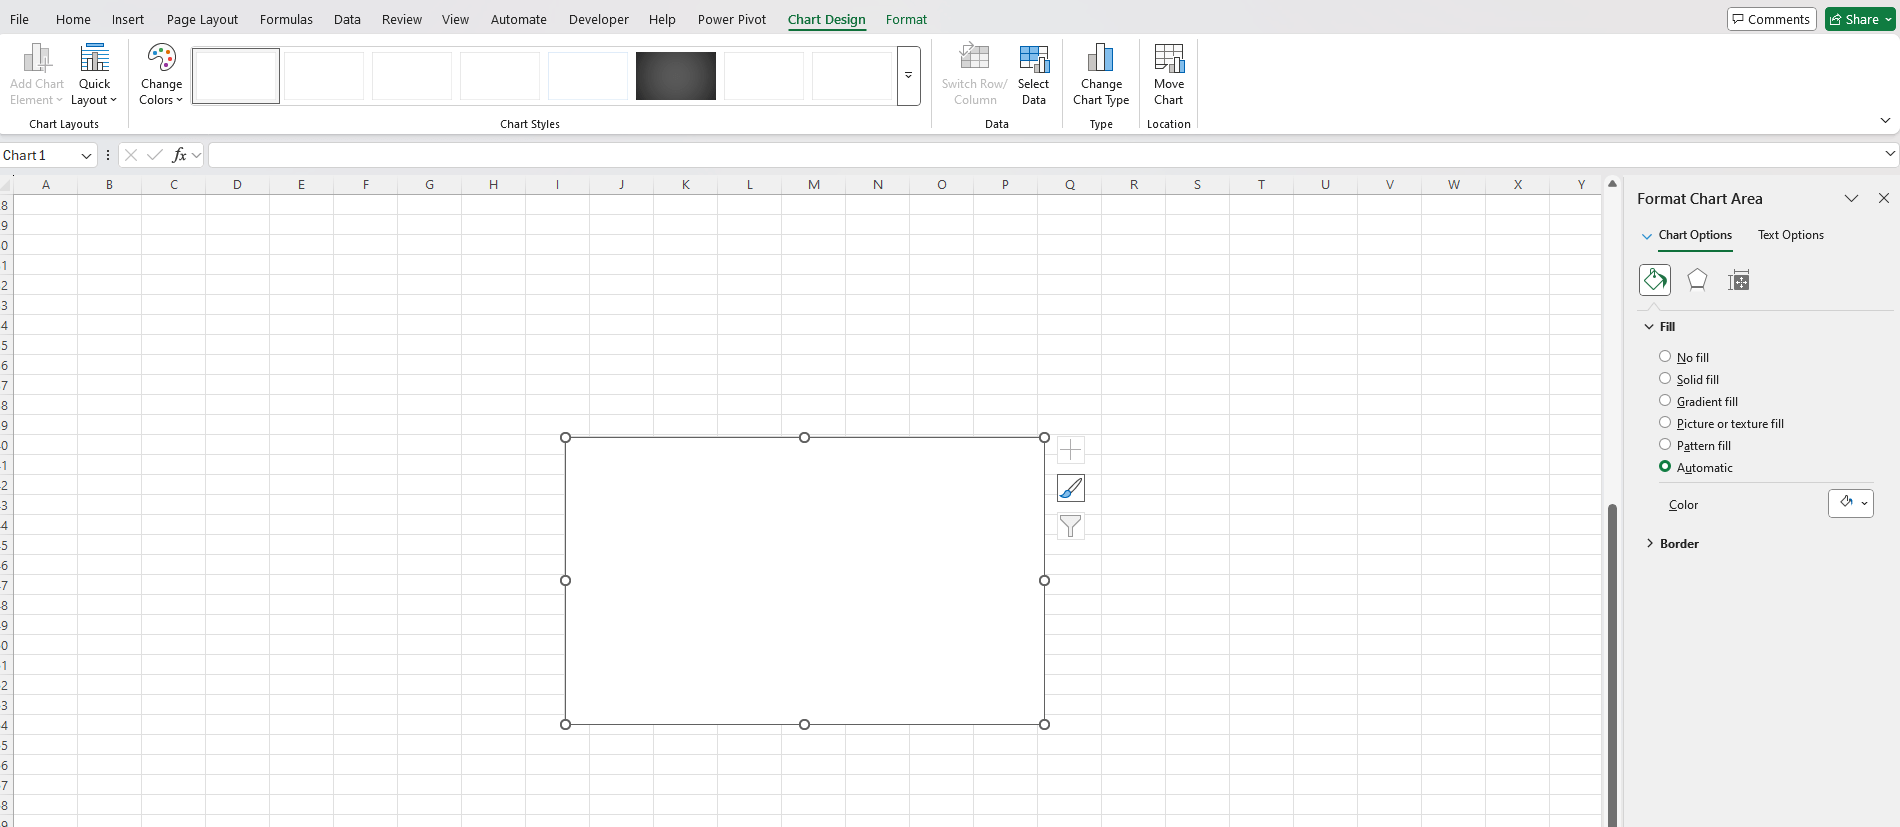
- Right-click and select Format Data Series.
- In the formatting pane, set the Fill option to No Fill. This will make the Start Date bars invisible, leaving only the duration bars visible.
B. Adjust Task Order
By default, the chart will show tasks starting from the top, but we want the chart to display tasks starting from the top of the timeline. To do this:
- Right-click on the vertical axis (task names).
- Select Format Axis.
- Under Axis Options, check the box that says Categories in reverse order.
This will ensure that the tasks appear in a logical order from top to bottom.
C. Modify the Timeline
Now, let’s adjust the timeline at the top of the chart. You can change the date format and time scale to suit your needs.
- Right-click on the horizontal axis (date range).
- Choose Format Axis.
- Under Axis Options, set the Minimum and Maximum bounds to reflect your project’s start and end dates.
- You can also adjust the Major Unit to change the scale (e.g., set it to 1 day, 1 week, or 1 month).
Step 4: Add Task Labels and Customize the Chart
To make your Gantt chart clearer, let’s add some task labels and additional formatting to improve the visualization:
A. Add Data Labels
- Right-click on any bar representing Task Duration and choose Add Data Labels.
- You can format the labels to show the task name, duration, or start date depending on what you need.
B. Add Color to Different Tasks
To make your chart more visually appealing, you can color code tasks based on their priority or category.
- Click on a task bar to select it.
- Right-click and choose Format Data Series.
- In the formatting pane, select Fill and choose a color. Repeat for other tasks as needed.
C. Add Milestones or Mark Important Dates
You can also add milestones to your Gantt chart, such as project reviews or deadlines. To do this, you could insert shapes or markers to highlight key dates, or use additional data series to mark specific milestones on the timeline.
Step 5: Make the Gantt Chart Dynamic
One of the biggest advantages of using Excel for project management is the ability to make your Gantt chart dynamic. By linking your chart to your data, any changes to the project’s start and end dates or task durations will automatically update the chart.
To make your Gantt chart dynamic:
- Adjust the Start Date or Duration in the data table.
- The Gantt chart will automatically reflect the changes once you refresh or update the data.
Get the best deals on genuine Office keys—affordable prices, instant delivery, and hassle-free activation!